Visualisation
CKAN’s data previewing tool has a host of powerful features for previewing data stored in the DataStore.
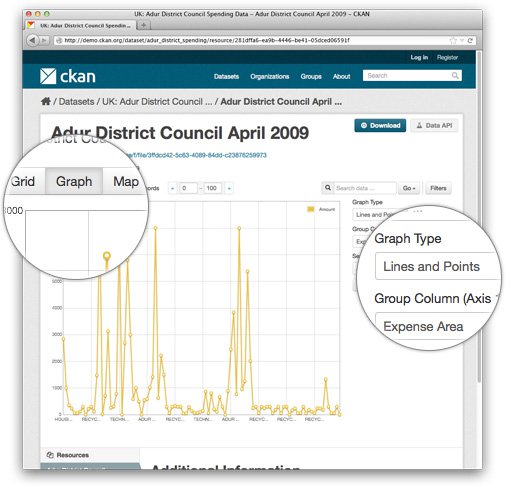
Table view: If structured data is uploaded or linked to CKAN as a .csv or Excel table, the DataStore loads it into a database, allowing CKAN to give a range of ways to view and process the data. Initially it is displayed as a table. The user can sort the data on particular columns, filter or facet by values, or hide columns entirely.
Graphing data: You can also display the data on a graph, choosing the variables on the axes and comparing a number of variables by graphing them together on the same y-axis.
Mapping data: If the table has columns that CKAN recognises as latitude and longitude, it can plot the data points on a map, which can be panned (dragged) and zoomed. Selecting a data point displays all the field values in the corresponding row.
Image data: CKAN’s previewing is not restricted to tabular data. Common image formats will be displayed, and if a resource is a web page, it will also be previewed directly in the CKAN dataset.
Roll your own: CKAN’s built-in previews use the DataStore’s API. If you have your own data previewing tools or are planning to build them, it’s easy to plug them into the API so that you can create visualisations on the fly, without the need for users to download the data.